Fight This Bullish Development At Your Own Risk

Sentiment was a HUGE problem for the bulls to start 2022 and now it's become a similarly big issue for the bears now. If you haven't noticed, most bulls don't begin to turn bearish until after all or most of the selling is complete. After we've endured a nasty bear market, either secular or cyclical, most bears can't see that a bottom has formed until after a major advance has already occurred. Media brainwashing is a real thing and Wall Street firms use this to their advantage to exit before retail traders and then buy back in just as retail traders acknowledge all the market weakness and bad news.
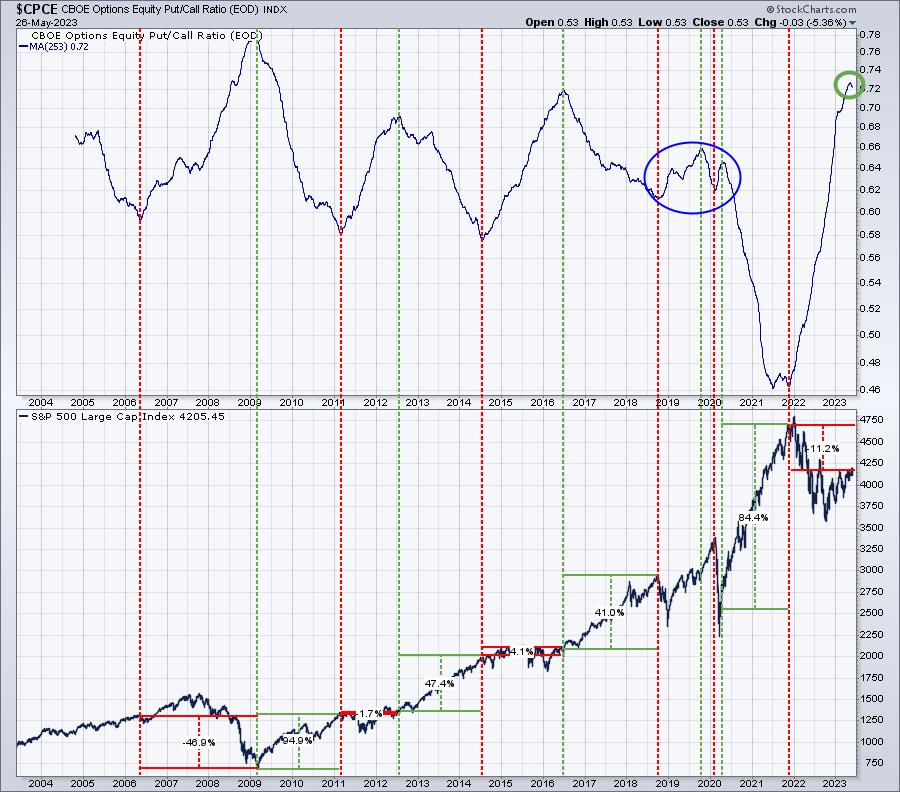
One signal to help call market tops and bottoms is by following the long-term moving average of the equity-only put-call ratio ($CPCE). I use the 253-day moving average (253 trading days = 1 year) and refer to it as my "freight-liner" sentiment signal, because it takes a long time to change the 1-year direction of the put call ratio. But the signals produced by it cannot be ignored. Here's the chart:
This simply makes good common sense to me. When traders turn overly bearish and believe the market MUST go lower, do you think they're invested on the long side? Probably not. They've already sold. After a long period of market weakness and a substantial increase in bearish sentiment, the market is sold out. There's little downside, because those wanting to sell have already done so. Therefore, when this "freight-liner" indicator begins to roll over, there's lots of cash on the sidelines to continue to propel the market higher and higher.
At first glance, the top right now looks a little bit suspect, right? After all, it's just barely turning down from the top and one argument is that this is a blip and the continuing market weakness will result in another push higher in this CPCE chart. But you have to understand a couple things. There were several readings of the daily CPCE in November and December that were artificially high. It was reported that big funds had taken sizable put positions in the largest market cap companies like AAPL, MSFT, TSLA, NVDA, GOOGL, etc. I saw those HUGE levels of put options in the CBOE half-hour readings that I follow, so it was fairly easy to pull those professional put buys out of the CPCE in order to reflect what retail traders are doing. After all, when I gauge sentiment, I want to know what the retail trading community is doing.
As a result of the above, I started a User-Defined Index at StockCharts.com. I used the daily CPCE readings on StockCharts, but I adjusted those daily readings that clearly needed adjusting. First, let me show you the readings that improperly impacted the daily readings:
The CPCE rises when retail traders panic. That's the historical norm and it makes sense. The highest reading of 1.35 came in 2008 during the financial crisis. ANY daily reading above 1.0 will coincide with stock market selling. But those November and December readings hit a high of 2.40 during a period when the stock market was rising! In my UDI, I adjusted the daily CPCE readings by removing these huge increases in equity puts that occurred in the middle of trading days. There were approximately 10 days that I adjusted. My UDI began in 2021, because I wanted to see how the 253-day moving average was truly reacting in Q4 2022. Here is my UDI chart on the CPCE and how it's trending now:
The rolling over of the 253-day CPCE is much more obvious after adjusting the ridiculous and overstated readings from November and December. History tells us that this is a MAJOR BUY signal. And it's not like I'm just pulling this up now to support my bullish stance. I also provided this to our MarketVision 2022 crowd in January 2022. It was just turning up at that time and I indicated that the stock market's biggest problem heading into 2022 was the 253-day moving average of the CPCE just starting to turn higher. It proved to be an excellent bearish call.
I remain adamant that you want to be long. I've had many bullish signals emerge over the past year, but this is a very important one that is adding more bullish fuel to the fire.
Our Spring Special is winding down and today's the last day to take advantage of the best market guidance on the planet! If you'd like to be a part of our EarningsBeats.com community and find out why our members are overwhelmingly satisfied, CLICK HERE and select the right plan for you!
Happy trading!
Tom


