

Commodities: Economic Indicators You Can’t Ignore
The commodities tried to rally but stalled this week at very important technical locations.
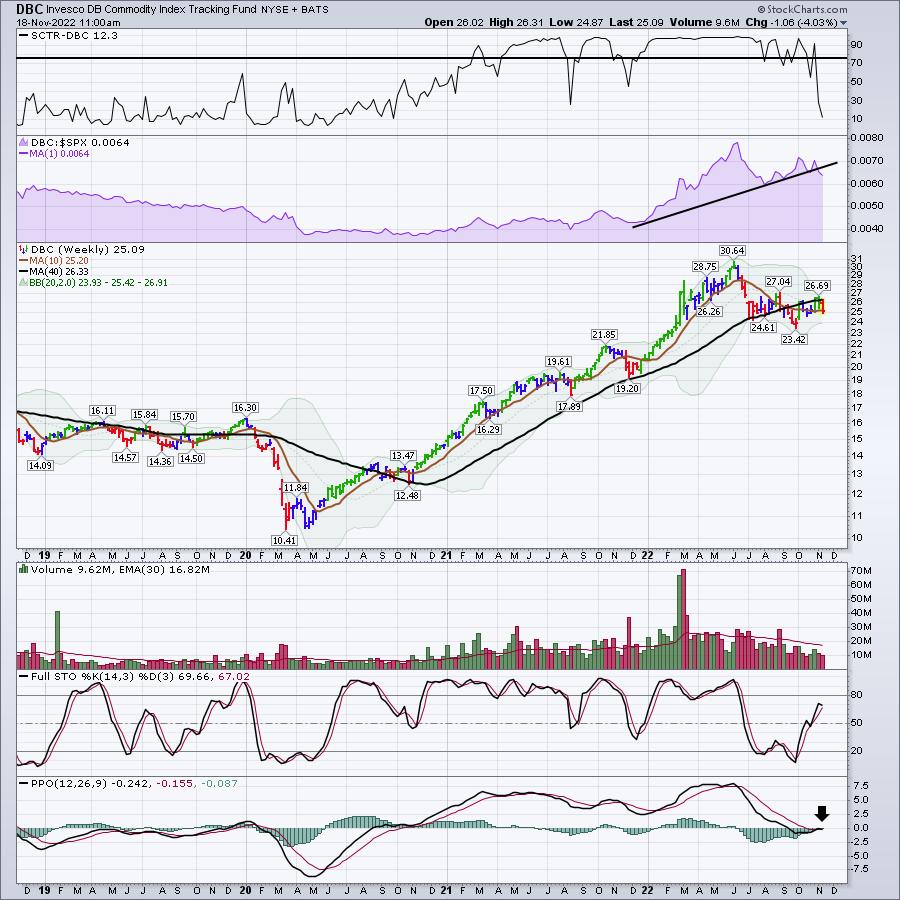
For example the DBC weekly chart doesn't look very good.
The SCTR is plummeting after 1.5 years of strength. 1st red candle since October started. Relative strength in purple breaking No volume PPO momentum right at zero and struggling to go higher.Looking at XOP
Oil exploration companies are struggling to take out the spring highs. We have been here for three weeks.
Testing a prior high and struggling. Not uncommon, but hardly euphoric based on what the indexes are doing. DIA is up 20% off the lows. First blue candle at least hints at a weakening trend. No volume coming in PPO losing upside momentumI would say this is still a strong chart but based on the DBC chart above it is worth watching closely.
I was so thrilled to see copper break out, only to see copper miners bang their heads on the 40 WMA. Important resistance until broken. SCTR ranking failing to hold up. The PPO is below zero and needs to continue to accelerate higher.
For me, it is starting to look a lot less likely that commodities can soar. One week doesn't make a trend. I'll have a lot more on my weekend newsletter. Critically important that we understand the economic indicators like housing, copper, oil, including commodities in general. If you would like to see what we offer, feel free to try a subscription at $7 at Ospreystrategic.org. It will let you check out our past picks and newsletters as well.